Introduction to Voyager
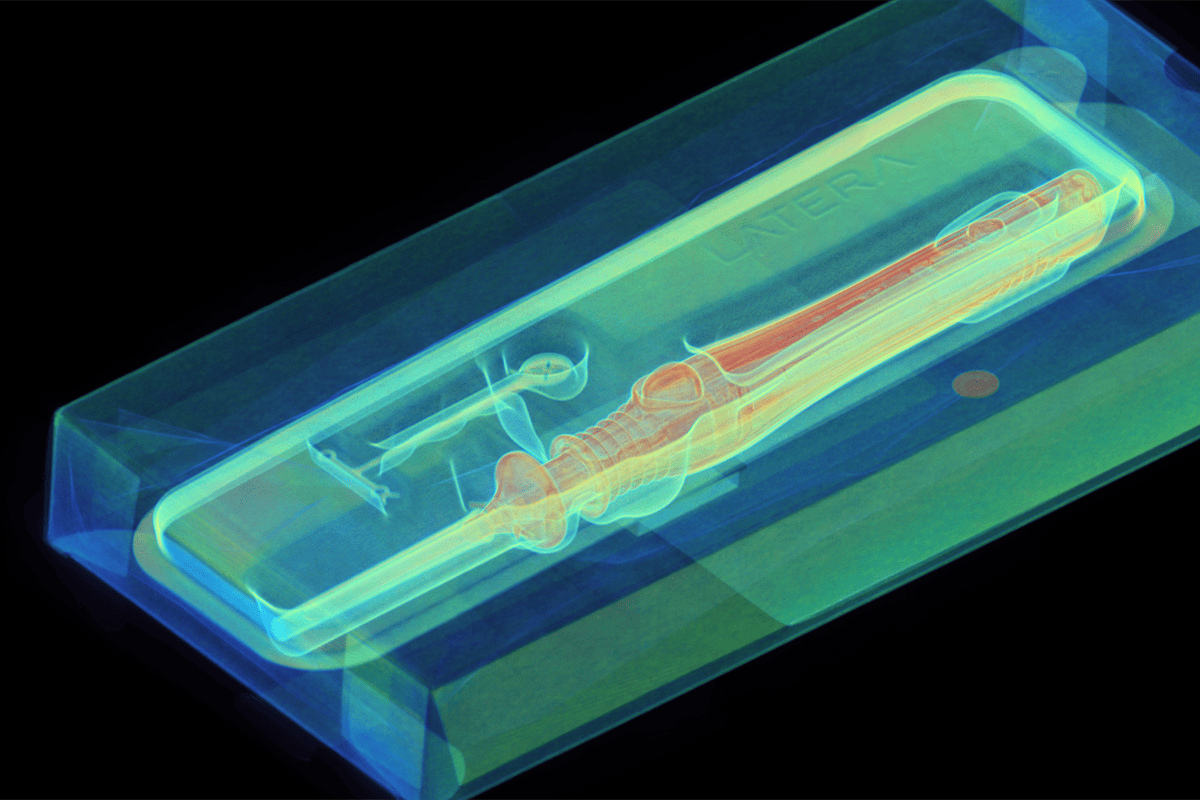
Industrial CT scanning has become an indispensable tool across industries, including electronics, automotive, sports equipment, medical devices, and food inspection. It provides detailed spatial configuration and density information, offering deep insights into the external and internal workings of your components without causing any damage.
Whether you’re investigating the structural integrity of an aerospace component or optimizing manufacturing processes for batteries, CT scanning offers incredible clarity.
Voyager is our browser-based platform designed to make complex CT scan analysis intuitive, powerful, and collaborative. Built for product designers, manufacturing experts, engineers, and decision-makers, Voyager streamlines the analysis process. Let’s dive into its features.
Browser-based analysis
Navigating and analyzing CT data can be complex, but Voyager simplifies the experience, even for first-time users. When you open a scan in Voyager, you’ll see different sets of CT data, including 2D X-ray images called Radiographs, and 3D Reconstructions. This data is neatly organized in the Data Panel on the left, making navigation easy. The Viewport in the center brings your scans and analyses to life, while the attributes panel on the right offers tools and parameters for viewing, analysis, or sharing purposes. The top toolbar houses Voyager’s extensive visualization and analysis features, making every tool you need readily accessible.
Regions of Interest (ROIs)
Voyager offers powerful tools for segmenting and visualizing CT data. The first step in analyzing a scan is focusing on a specific Region of Interest (ROI). ROIs improve the resolution of your visualization, allowing you to remove extraneous data and enhance the precision of your analysis. Creating an ROI is straightforward: you can manually select the ROI tool from the toolbar and drag in the viewport to specify your area of interest, or use Voyager’s built-in automation tools to accelerate analysis on batches or repetitive scans.
Color Maps and Visualization
Voyager’s visualization tools allow you to distinguish data within your part or assembly. The range map, or histogram, represents the density distribution of different materials in your scan, helping you segment materials by adjusting the sliders to include or isolate specific materials. Various color maps reveal subtle differences in material composition, highlight flaws, or make your data more accessible.

3D views and 2D slices
Voyager’s ability to switch between 3D and 2D views offers a comprehensive perspective on your scanned object. These views are crucial for understanding both the external and internal structure of your component and for communicating scan data and analyses to stakeholders. 3D views provide a global perspective to assess the overall condition of the object, while 2D slices allow for detailed examination of internal structures, helping you spot potential defects.
Organizing and sharing projects
Quickly referencing and sharing areas of interest is key to solving design and engineering challenges faster. In Voyager, you can use bookmarks to capture specific states of your CT scan data and analysis for future reference or sharing with colleagues. You can add comments to bookmarks for more detail and quickly toggle between them and your analysis. Being browser-based, Voyager makes sharing and collaboration easy. Stakeholders can view data on any platform or device from anywhere, and managers can control permissions to ensure sensitive data is shared appropriately.
We’re excited to see you use these tools to tackle your toughest design and engineering challenges.
Try Voyager for yourself now for free, or reach out to our team.
Get in touch.
Are you a current customer? Head over to our Support site for detailed documentation and tutorials.